Alumni Outcomes
Alumni Headlines
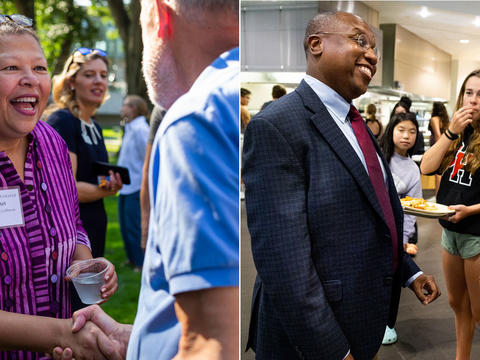
Sarah Willie-LeBreton ’86 and Garry W. Jenkins ’92 joined President Wendy Raymond for a lively discussion about their influences and ambitions for the colleges they now lead.

Levin, who made his mark in leadership roles at HBO and Time Warner, died March 13.
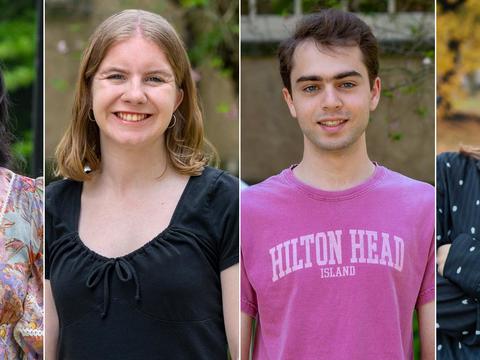
Four recent graduates received awards for the 2023-2024 academic year. They are currently engaged in work across three continents.
Alumni Outcomes by Industry & Graduate Study
This interactive visualization of paths after Haverford highlights our graduates’ jobs and post-graduate education at 1, 5, 10, and 25-year milestones. These slices of our alumni community illustrate the potential of a Haverford education.
First Destinations: Where Did the Class of 2023 Go?
This report is based on information collected through surveys administered to the class of 2023 at graduation and six months afterward, as well as LinkedIn searches, and faculty/staff knowledge. These sources confirmed the post-graduation plans for 301 of the 352 graduates, representing an 85.5% knowledge rate as of 12/31/23. Data in this report are based on information from these 301 graduates.
2023 Career Plans
| Career Plans | Percentage |
|---|---|
| Employed | 63 |
| Graduate/Professional School | 31 |
| Fellowship/Gap Year Program | 6 |
| Still seeking | 2 |
*Total percentage exceeds 100% as students selecting more than one option are counted twice.
Industries
of Percent of Class who are Employed
- 30% Business & Financial Services
- 30% Science & Technology
- 11% Healthcare & Public Health
- 6% Government & Public Service
- 5% Law
- 5% Other
- 1% Media & Communication
- 1%Social & Human Services
- 1% Manufacturing & Logistics
- 1% Art, Design & Performing Arts
82% of those working responded that their employment path was mostly or directly relevant to their career interests.
Most Frequent Employers
The class of 2023 is working at 173 unique organizations. The organizations that hired the highest number of graduates from the Class of 2023 included University of Pennsylvania (9), Epic Systems (5), Bank of America (3), Children's Hospital of Philadelphia (3), Department of Justice-Antitrust Division (3), and National Institutes of Health (3), and Perpay (3). Since so few graduates work for the same organization in a year, the data below shows the organizations that hired the highest number of graduates from the classes of 2016-2023 (as reported at graduation).
- University of Pennsylvania
- Haverford College
- Children's Hospital of Philadelphia
- Perelman School of Medicine (Penn Medicine)
- Haverford House
- The Vanguard Group
- Epic
- AmeriCorps
- National Institutes of Health
- Quaker Voluntary Service
- Amazon
- Boston Consulting Group, Inc.
- Goldman Sachs
- Elite Scholars of China
- Cravath, Swaine & Moore
- M&T Bank
- Teach for America
- Brigham & Women's Hospital
- New York University Shanghai
- The Lewin Group
Most Frequently Attended Graduate & Professional Schools
The class of 2023 is studying at 44 unique universities. The University of Pennsylvania was the top choice for graduates from the class of 2023 to continue their studies, with 27 graduates matriculating. Additional frequent programs for the class of 2023 included Thomas Jefferson University (6 graduates attending), Columbia University (4 graduates attending), and Cornell University (3 graduates attending). Since so few graduates attend the same university in a single year, the data below shows the universities that Haverford graduates from the classes of 2016-2023 reported they planned to attend (as reported at graduation).
- University of Pennsylvania
- Columbia University
- Thomas Jefferson University
- University of Chicago
- Cornell University
- Yale University
- Sidney Kimmel Medical College
- University of Michigan, Ann Arbor
- Harvard University
- Stanford University
- New York University
- Emory University
- Temple University
- Duke University
- Villanova University
- University of Virginia
- University of California, Los Angeles
- Claremont McKenna College
- Northwestern University
- Boston University